We no longer support this browser. Using a supported browser will provide a better experience.
Please update your browser.
Soaring home prices are making homeownership significantly less affordable for American consumers, especially young and first-time homebuyers, with nearly 39 percent of Gen Z hopefuls citing saving for a down payment as their greatest obstacle.1 While down payments are often the focal point of surveys and discussions, their role should not obscure the significant challenges posed by closing costs. Closing costs can be substantial—potentially amounting to a hefty percentage of the purchase price—and can be as much of a barrier to homeownership as down payments.
Down payment requirements offer a clear link between affordability concerns and macroeconomic forces like high prices, low inventories, and high interest rates. Closing costs, however, are less transparent but no less impactful. The mix of fees—appraisals, flood insurance, title insurance, and more—can create a confusing obstacle course for prospective homeowners, especially first-time buyers, making it difficult to save for these costs or make informed choices with respect to them. Today’s consumers are even less aware of how the evolving market landscape quietly shapes the loan costs they face. The recent retreat of large banks from the mortgage market has served to intensify the ongoing tilt toward nonbanks who originated 61.6 percent of all closed-end first-lien single-family home purchase loans in 2022.2
The diminishing presence of traditional banks in the mortgage origination market potentially sets the stage for an even greater concentration of nonbank lending. Decreased competition can in turn lead to increases in upfront fees.3 This evolving landscape could narrow borrowers’ choices and directly influence the fees they incur, making the selection of a lender a critical decision with significant financial implications. While many discussions on homeownership barriers focus on factors like race or housing supply, we believe that the role of lender selection also deserves attention, echoing a growing chorus of researchers who have raised similar concerns.4 This insight sheds light on how different lending models affect closing costs and the extent to which these costs vary across racial groups. Furthermore, we delve into how borrowers’ mortgage literacy and preferences influence decisions about lenders and, ultimately, costs to the borrower.
Data Build
We analyzed public Home Mortgage Disclosure Act (HMDA) data from 2021 and 2022. To classify lenders, we merged the HMDA data to a lender classification file—the “Avery File”—and grouped into three classes: Nonbanks, Banks/Credit Unions (combined as “banks” for simplicity), and Broker/Correspondent Lenders (“brokers”).5 We focused on 3.9 million 30-year fixed, conforming purchase loans for single-family primary residency. We excluded loans with unusual features like reverse mortgages or non-amortizing features.6
We focused on purchase loans for several reasons. Refinancings often involve rolling closing costs into the financed loan amount, making fee comparisons potentially unreliable. Certain non-depository lenders, like some fintech firms, primarily target the refinancing market segment, particularly nonprime, low-income, and minority communities.7 Comparing across lender types in the purchase market provides a more balanced view of competitive pricing strategies across different lenders.8
We combined HMDA, American Community Survey, and Credit Insecurity datasets to study relationships between income, race, lender type, and loan closing costs. We approximated closing costs by summing “Total Loan Costs” and “Total Points and Fees.” While HMDA has significantly improved in capturing lender fees, limitations remain. Expanded HMDA does not capture all out-of-pocket costs or offsetting credits received by borrowers. However, the enhanced data can still provide valuable insights into the impact of race and lender type on closing costs.
Background: Community Credit Insecurity Reinforces Structural Barriers
Rising prices and a high interest rate climate continue to move the target beyond reach for many aspiring homebuyers, especially those with low incomes struggling to save for or afford the costs of a mortgage. A tight market compounds financial pressures and constrains borrowers’ choices—both in terms of the lenders they can turn to and the availability of affordably-priced products to choose from. We used novel data from the Federal Reserve Bank of New York’s (FRBNY) Credit Insecurity Index to situate the complex web of challenges within local credit economies. Our analysis shows that borrower struggles with closing costs are not isolated but rather stem from systemic issues of credit availability and quality. We compute a closing cost burden as the proportion of a borrower’s income spent on loan fees. The measure highlights the degree to which these costs compound financial strain for borrowers, especially when considered in the context of credit insecurity.
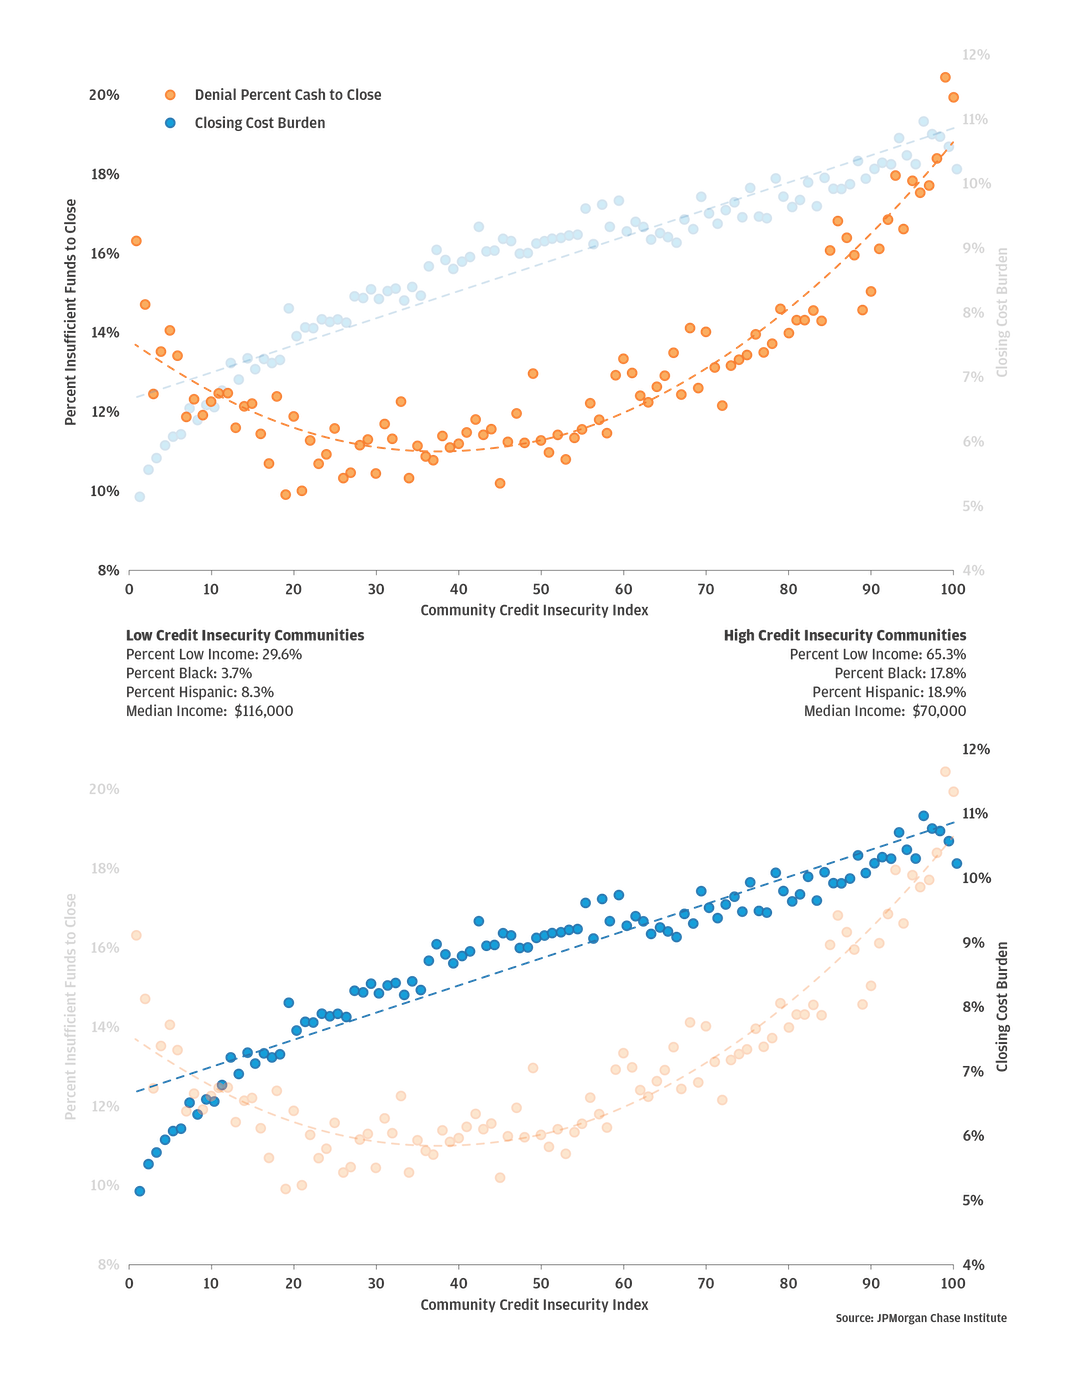
FRBNY’s Credit Insecurity Index is designed to measure community financial well-being though the lens of access to credit, a financial asset that supports financial resilience.9 Beyond identifying “credit assured” and “credit insecure” communities, the index characterizes the local economy’s capacity to provide accessible credit products on fair terms. The binscatter plot depicted in Figure 1 indicates a clear correlation between average closing cost burden in a census tract and its level of credit insecurity. Borrowers in credit insecure communities face disproportionately higher closing cost burdens compared to those in credit assured neighborhoods. Increased closing cost burdens pose significant risk for borrowers with limited savings and low incomes. A larger share of income allocated to closing costs and down payments depletes vital cash reserves, heightening the potential for future delinquency and further entrenching the cycle of credit insecurity.10
These increased upfront liquidity burdens have also impacted borrowers’ credit eligibility. We analyzed rates of denials for insufficient funds to close and found a similar positive correlation with community credit insecurity. Higher rates of insecurity coincided with an increased incidence of denials due to the inability to afford down payments and closing costs.
Figure 1: Denial rates for insufficient closing funds & closing cost burden by credit insecurity
Denial rates for asset insecurity and closing cost burden are positively correlated with community credit insecurity.
Data Source: Federal Reserve Bank of New York Community Credit Insecurity Index. The scores reflect the extent of credit insecurity across the U.S. The index measures populations not included in the formal credit economy and groups facing credit constraints.
The correlation between credit insecurity and financial insufficiency suggests that a harmful feedback loop—exacerbated by unaffordable prices—makes homeownership increasingly inaccessible in areas facing high credit insecurity.11 In these communities, credit insecurity not only limits access to homeownership but also hinders the ability to save for down payments or afford closing costs. In many ways, the patterns displayed in Figure 1 are a combination of borrowers’ financial circumstances and different policies that shape homeownership accessibility, particularly in credit-insecure communities. These trends not only point to affordability-driven barriers but also raise pressing questions about the mechanisms driving these dynamics, such as the pricing policies of different lender types and the choices borrowers make when purchasing a home.
Administrative closing costs, which tend to be relatively fixed, can sometimes be as substantial as the down payment itself. With home prices higher than they have been in a decade, the affordability of these costs has hinged on where and with whom borrowers shopped for mortgages. Thus, navigating the economic forces driving affordability or lack thereof depends crucially on informed decision-making. To isolate the effects of choosing various lender types on loan closing costs, we used a regression analysis that controls for various factors that influence cost differences, such as loan-to-value (LTV), debt-to-income (DTI), income, race and ethnicity, rate spread, loan characteristics, and neighborhood attributes, among others.
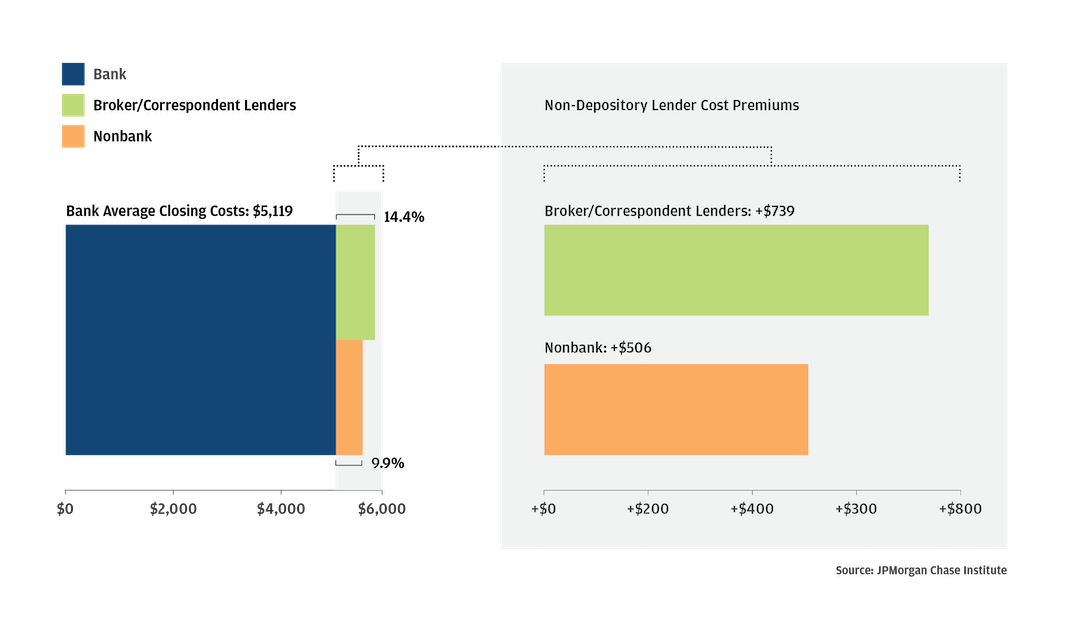
Our analysis revealed that the choice of lender plays a pivotal role, significantly impacting the financial strain a borrower may face. We noted marked differences in pricing structures across the various lending institutions in our sample, underscoring concerning implications for borrowers who obtain loans from non-depository lenders. Borrowers with bank-originated loans—our baseline lender group—paid an average $5,119 in closing costs. This baseline cost can be a significant burden for borrowers with low incomes. For instance, the baseline cost for borrowers in the lowest income quartile averaged 11.6 percent of their average annual income. But our analysis shows that shifting from banks to brokers and nonbanks increases closing cost burdens still further.
Figure 2 shows that borrowers who choose broker-intermediated loans can expect their loans to be, on average, $739 more expensive than if they had dealt with a bank, a closing cost surcharge of 14.4 percent. Similarly, those opting for nonbanks are likely to face an average markup of $506, or an additional 9.9 percent. The substantial broker surcharge indicates that the convenience of broker-intermediated services comes with a significant affordability cost. These cost premiums of a few hundred dollars are quite significant relative to income. For example, adding the $739 broker premium to the average closing costs from bank-originated loans brings the total to $5,858, whereas the estimated total fee from a nonbank amounted to $5,625. The magnitude of fees associated with non-depository lenders can add 1.5 percentage points in additional closing cost burden for borrowers in the lowest income quartile, raising their overall burden to 13.1 percent compared to 11.6 percent for bank-originated loans.
Figure 2: Navigating mortgage closing costs—lender type impact
Borrowers using nonbanks and broker lenders can expect to pay significantly more in upfront loan costs compared to depository lenders. These increased costs can make access to homeownership challenging.
Data Source: +Regression adjusted cost premiums. 2021 & 2022 HMDA data. Lender classifications obtained from the HMDA Lender File constructed by Robert Avery, dataset contains matching asset and charter information for all lenders in reported HMDA file.
Most mortgage closing costs are unavoidable expenditures, so the composition of these fees matters a great deal to borrowers, particularly for those who can least afford them. Origination charges are a significant part of overall closing costs levied by lenders to cover the various costs associated with making loans, such as underwriting, processing, and marketing. These charges also incorporate profit margins and the cost of capital. Although these components are not individually discernible in the HMDA data used, our analysis of origination charges reflects the broader lender pricing differences shown in Figure 2. Nonbank origination charges were, on average, 24.7 percent ($487) higher than those of banks. Broker origination premiums, at $718, were roughly 1.5 times larger than nonbanks.
Closing costs represent a substantial financial consideration for many households, challenging their capacity to rebuild savings post-purchase. This burden is especially acute for low-income borrowers, for whom having lower cash reserves after closing increases delinquency risk and vulnerability to financial shocks, such as unexpected home repairs or healthcare expenses.
Restricting the sample to low-income individuals showed that while cost differentials narrowed across the lending spectrum, which is in part driven by lower loan amounts in this segment, the dynamic of the non-depository premium persists. The broker premium decreased significantly among low-income borrowers. On average, low-income borrowers dealing with brokers incurred closing costs that were $370 more than their counterparts who opted for bank mortgages.12 Similarly, the nonbank cost premium decreased substantially within this restricted sample, with low-income borrowers with nonbank-originated loans facing an average additional cost of $387. Put into perspective, this means low-income borrowers can expect to pay closing costs ranging from $4,586 to $5,505 across different lender types. For a borrower earning $50,000 annually, these costs alone represent a significant 9.2 percent to 10.0 percent of nominal income.
Faced with these affordability strains, cost-sensitive borrowers may tap into lender credits to alleviate the burden of upfront fees. Negotiating these credits typically results in borrowers passing all of their closing cost through their interest rates, resulting in a higher rate. As we acknowledged, HMDA data has limitations that make it challenging to distinguish a general lender credit that one borrower may receive to remedy an error in payment from the type of specific lender credits that another receives to reduce their costs overall. Nevertheless, the HMDA-reported lender credits offer essential insights into their usage. Notably, borrowers with broker-intermediated loans were more likely to use lender credits compared to those dealing with banks (1.2 times) and nonbanks (1.5 times).13 Opting to finance closing costs through interest rates is a significant decision that implicitly raises origination costs and could exacerbate long-term affordability challenges. Higher lender credit usage within the broker segment could indicate that borrowers are relying on these credits to manage the significantly higher closing costs or that these lenders are more likely than their bank and nonbank counterparts to offer borrowers lender credits.
Overall, our findings on cost differences underscore the impact of different lending models’ pricing structure on closing cost variation and their effect on borrowers’ costs and potential affordability management strategies. Although the precise mechanisms behind mortgage pricing regimes fall outside the scope of this report, the marked differences in pricing between brokers, nonbanks, and banks suggest that certain characteristics of non-depository lenders could present affordability challenges for borrowers utilizing these channels to secure loans.
Nonbanks, including brokers, are more likely to serve minority borrowers than traditional deposit-taking loan originators, but this comes at cost. While this specialization expands access to credit in underserved communities, it may inadvertently lead to additional closing cost burdens for these groups—a factor not entirely captured by assessing racial disparities alone.14
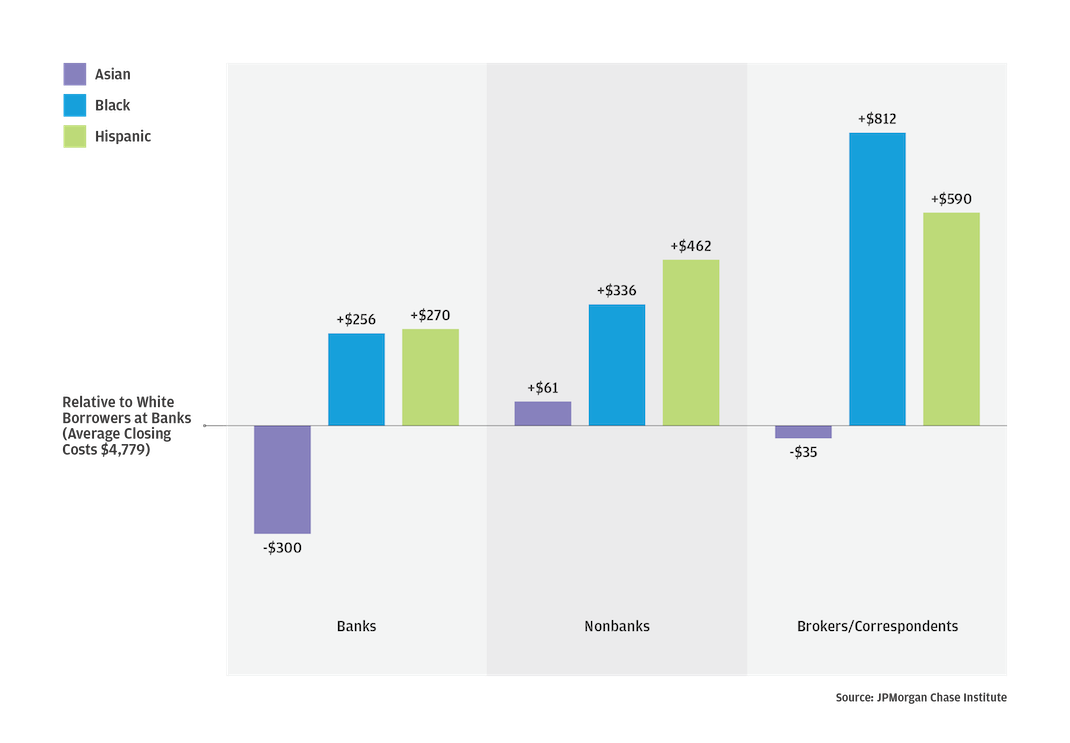
Our analysis found the relationship between race and loan costs varies significantly across different lender types. We analyzed cost differences for each racial group relative to our combined baseline group: White borrowers utilizing bank-originated loans. This baseline group allowed us to measure how closing costs for each racial group diverge from the typical experience of a White borrower who obtained a loan from bank. Figure 3 describes how cost differences by race change with a certain lender type by summarizing the component effects of lender type and race.
The left panel of Figure 3 indicates that racial disparities are apparent even for banks where average closing costs are the least, with Black and Hispanic borrowers facing higher costs and Asian borrowers benefitting from lower costs compared to White borrowers. Our analysis indicated that, even after considering various factors, Black and Hispanic borrowers still faced higher average closing costs within the bank segment. Figure 3 shows that Black borrowers, on average, paid $256 more in loan fees than White borrowers, while Hispanic borrowers incurred an additional $270. Conversely, Asian borrowers opting for banks benefitted from a cost advantage, paying $300 less in closing costs on average than White borrowers.
Figure 3: Decoding racial disparities—the compound impact of race and lender type
Data Source: 2021 & 2022 HMDA data. Lender classifications obtained from the HMDA Lender File, dataset contains matching asset and charter information for all lenders in reported HMDA file.
As shown in the other panels of Figure 3, racial disparities are not exclusive to banks but present to an even greater degree with nonbanks and brokers. Each data point across the panels represents the total racial effect associated with each lender type by combining the overall baseline racial effect with the additional impact for non-White borrowers for that lender type. For example, the total disparity specific to Black borrowers utilizing nonbanks is $336—the average baseline racial disparity and the additional disparity associated with nonbanks. For Hispanic borrowers accounting for the nonbank additional impact considerably increased their baseline disparity to $462. Interestingly, cost disparity for Black borrowers at nonbanks versus banks was small compared to Hispanic borrowers, possibly indicating that the racial disparity specific to this group may not necessarily increase when shifting to nonbanks.
Intriguingly, while Asian borrowers generally enjoy considerable cost savings relative to White borrowers within the context of bank lending, shifting to nonbank lenders comes with additional costs that reverses their baseline cost advantage. In other words, the shift to nonbank represents substantial race-driven costs for Asian borrowers as they encounter a different lending landscape that may reward their financial profile less favorably.
Racial disparities associated with brokers are comparatively steeper than those seen for nonbanks. Shifting to broker-intermediated loans could add several hundred dollars to the baseline disparities, raising affordability concerns that are especially pronounced for Black borrowers. Black borrowers using broker-issued loans incurred, on average, a total race-based premium of $812, whereas the Hispanic premium was comparatively smaller at nearly $600. Although Asian borrowers benefitted from modest savings at baseline, utilizing broker loans significantly narrowed their cost advantage underscoring the conditional nature of closing costs in the mortgage landscape. Research by Ambrose, Conklin, and Lopez (2020) explains this broker cost dynamic could be driven by the broker’s race, showing that Black and Hispanic borrowers incur higher fees when using White brokers, while no significant disparities existed with Black brokers.15
Disparities for Black and Hispanic borrowers compound when shifting to non-depository lenders as they incur two layers of marginal costs: the premium associated with these lender types and additional racial disparities. Non-depository cost premiums are not unique to borrowers of color, all borrowers using these channels are impacted, though the financial challenges compound for Black and Hispanic borrowers in particular. For instance White borrowers with broker-originated loan pay, on average, $618 more than their White counterparts with a similar bank-originated loan. However, the premium reduces to $453 for White borrowers when considering nonbank loans. Non-White borrowers encounter this baseline lender-based differential in addition to the specific racial disparities discussed earlier. For instance, Hispanic borrowers opting for nonbank loans would, relative to a bank loan, incur the additional baseline cost premium and the total race-based disparity specific to Hispanic borrowers resulting in substantially higher loan costs. This compounded effect underscores how the dual-layered penalty—based on race and lender choice—amplifies cost disparities for Black and Hispanic borrowers in particular.
The absence of individual credit scores in the publicly available HMDA data means we could not control for individual creditworthiness despite including borrower-level variables like debt-to-income, loan-to-value, and rate spread. To mitigate concerns that omitted credit scores could compound our results, we included the credit insecurity index, measured at the census tract level, as a control to account for the aggregate effects of credit worthiness. The index draws on credit scores and other aspects of credit such as thin files, its construction provides a mechanism for us to account for credit risk in the analysis. Our findings align with other studies that include borrower creditworthiness directly, suggesting that closing costs are likely more influenced by borrower decisions and lender structures than credit scores.16 Nonetheless, our race-based findings are significant, but they must be interpreted cautiously. They do not imply a causal relationship between a borrower’s minority identity and higher closing costs. Rather, they highlight the ways socioeconomic status and racial identity might intersect with credit costs, warranting deeper investigation and understanding.
Some version of the idea that comparison shopping yields the best mortgage rate shows up in most financial education campaigns. But what do borrowers really understand when mortgage shopping and what factors drive their eventual choices? As we have shown race and lender type may shape borrowers’ closing cost outcomes. Here we explore survey evidence from the National Survey of Mortgage Originations (NSMO) to derive qualitative first-order insights into these questions.
We categorized NSMO questions into two groups: one set aimed at understanding the factors borrowers prioritize before choosing a mortgage, and another that explores their mortgage literacy after obtaining a mortgage. NSMO’s unique timing—surveying borrowers who recently navigated the lending system—provides a valuable window into borrowers’ decision-making processes. We weighted the NSMO sample to match the distributional characteristics of the HMDA sample and conducted a series of regressions to identify race-based differences in mortgage selection preferences and literacy.
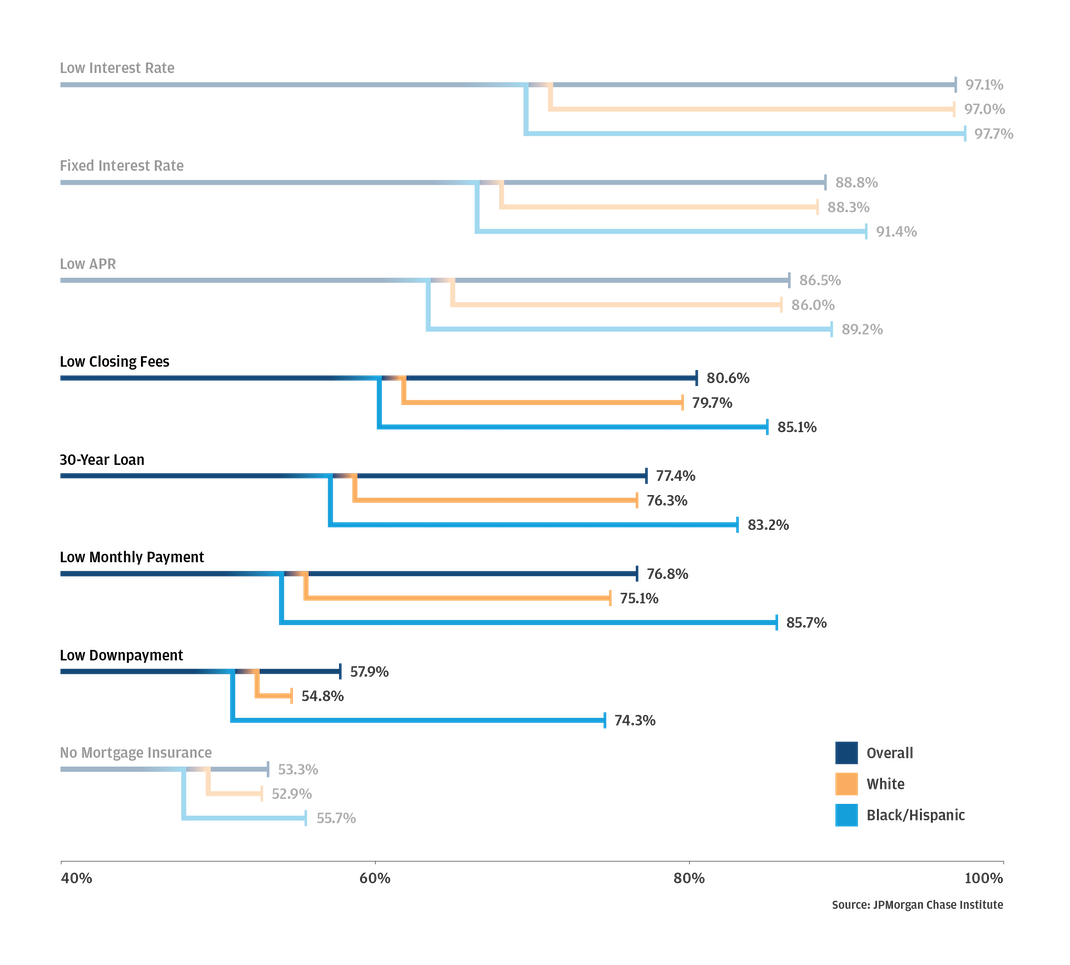
Figure 4a: Shopping preferences: what matters most to borrowers
Figures 4a and 4b presents the distribution of selection preferences and areas of lowest mortgage literacy. Across all borrowers, cost-savings factors like low interest rates and low closing costs are key priorities. However, sustainability features such as low down payments, manageable payments, and affordable closing costs hold more significance for Black and Hispanic borrowers. For instance, these borrowers place 35.6 percent higher importance placed on low down payments than their White counterparts. Similarly, Black and Hispanic aspiring homebuyers find affordable closing costs 6.8 percent more important than White shoppers. Even when accounting for characteristics such as income, credit score, first time homebuyer status, and educational attainment, these raw cost sensitivities persist, though the magnitudes of the differences decrease. Put simply, all else being equal, when Black and Hispanic homebuyers are evaluating mortgage products, they are more likely to prioritize low down payments (8 percent) and low closing costs (3.1 percent) than White shoppers. These analyses emphasize the importance of favorable terms at choice for these groups, suggesting that tailored mortgage products with lower downpayment requirements or affordable closing costs may be especially appealing to Black and Hispanic homebuyers.
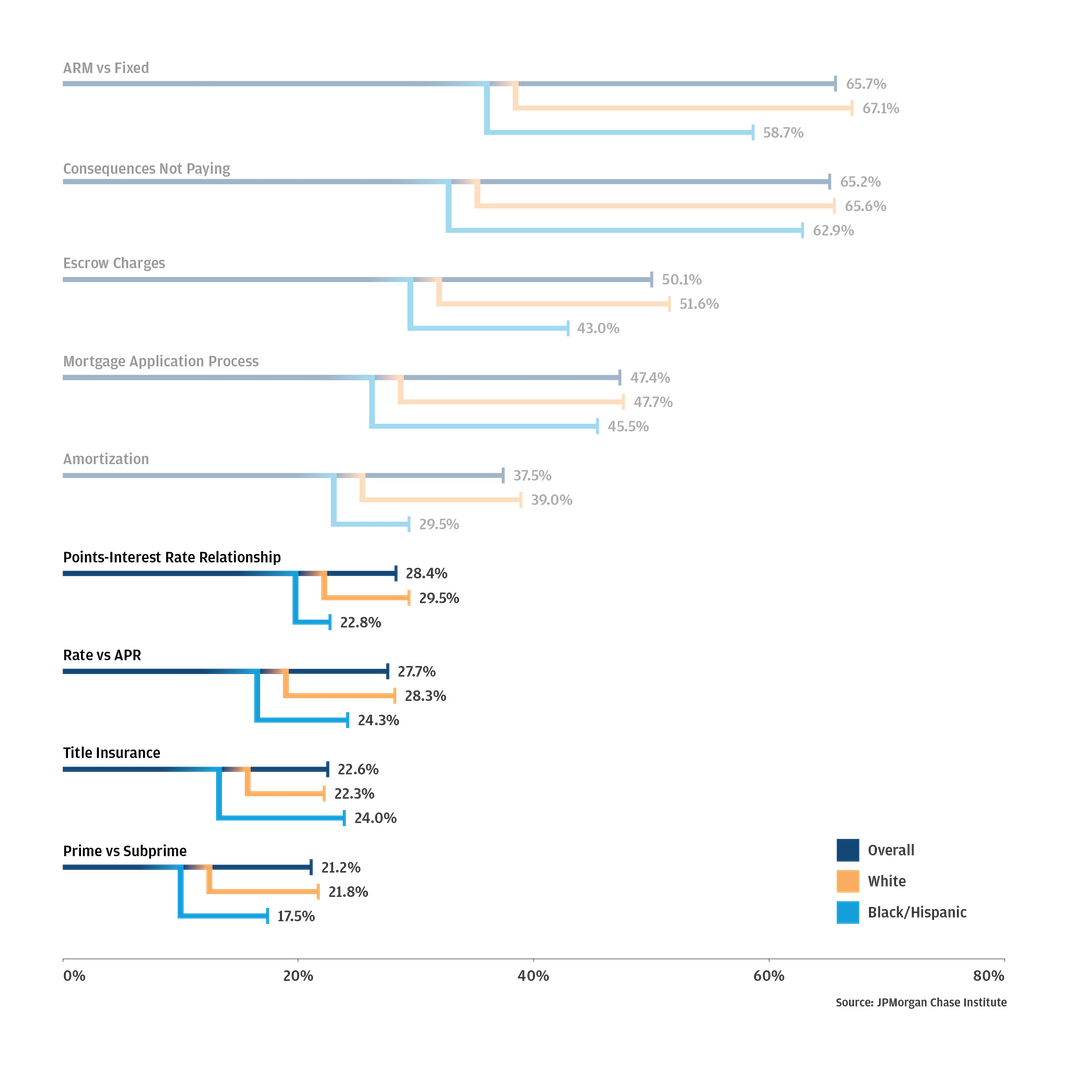
Figure 4b: Mortgage literacy: gaps in borrower understanding
Understanding the fundamentals of mortgage economics is critical to ensure that cost-savings preferences translate into actual cost-effective mortgage choices. However, we found concerning gaps in technical mortgage literacy that could negatively impact borrower cost-outcomes. Overall, technical mortgage literacy is concerningly low among all borrowers. Just 28.4 percent of those surveyed understand the relationship between points and interest rates. Not understanding the mechanics of this trade-off can lead to costly decisions that are cost-effective in the short term but significantly increase costs over the loan’s lifetime. Similarly, confusion about annual percentage rates (27.7 percent) or the distinction between prime and non-prime loans (21.2 percent) makes product comparison difficult. These gaps in mortgage economics could explain why comparison shopping among aspiring homebuyers is less than ideal. Fannie Mae’s National Housing Survey revealed that borrowers who shopped around tend to have more success in negotiations, regardless of income. However, high-income borrowers are more inclined to negotiate discount points and origination fees than their low-income counterparts, who are less likely to negotiate interest rates and other fees.17 Low mortgage literacy could lead borrowers to accept unfavorable terms or choose low rate mortgages without considering the risk of higher overall costs negating any savings.
Bridging the gap between mortgage literacy and cost-savings preferences is vital. It would empower borrowers to make more effective decisions, such as opting for an adjustable-rate mortgage loan or refinancing in a falling-rate environment. Bhutta, Fuster, and Hizmo (2019) support this, demonstrating that mortgage shopping and mortgage knowledge lead to better rates, but the benefits of shopping are less pronounced for groups with weaker mortgage knowledge. This is especially true for those with Federal Housing Administration (FHA) loans, low-incomes, or imperfect credit histories.18 This gap between technical mortgage literacy and selection preferences suggests that encouraging borrowers to shop around may not be as effective as advocates believe. Effective shopping requires that borrowers have the basic technical knowledge to evaluate the consequences of choices, such as negotiating lender credits and loan terms or understanding the implications of choosing among lender types. Our findings suggest that borrowers prioritize factors crucial to securing affordable mortgages, but they may lack the educational tools needed to achieve these goals.
Our findings shed light on the significant role lender type plays in loan closing costs and the disproportionate impact of these costs on non-White and low-income borrowers. Mortgage literacy gaps could exacerbate these disparities by undermining borrowers’ efforts to maximize mortgage affordability. Making informed decisions requires more than just comparing prices; it requires that borrowers have access to comprehensive mortgage literacy tools to comparison shop effectively across lender types, at the outset of the mortgage journey. Ultimately, borrowers need to be equipped with strategies and liquidity tools to enhance affordability.
Enhancing mortgage literacy initiatives to improve borrowers’ decision-making skills is imperative. Understanding the implications of shopping with different types of lenders should be as integral to mortgage literacy fundamentals as understanding interest rates and annual percentage rates. Even when comparing multiple loan estimates, rate-sensitive borrowers could end up choosing a higher-cost mortgage if they only shop with brokers. An effective consumer education tool would emphasize the variation of costs and interest rates across different lender types, guiding consumers to the best choice. Comprehensive consumer guides should elucidate when it is advantageous to shop with a broker or nonbank, and when choosing other lender types might be more cost effective.
In the current market—characterized by an acute lack of affordability and high interest rates—many borrowers may increasingly rely on lender credits to make homeownership feasible. However, trading lender credits for higher interest rates may not be a sustainable cost reduction strategy as it could lead to less affordable mortgage payments and slower wealth accumulation rates.[i] The introduction of initiatives like Fannie Mae’s limited HomeReady credit, which offers $2,500 in no-strings relief is an important step towards improving affordability. This innovative solution unconditionally lower down payments and closing costs could be promising.
Banks can play a crucial role in addressing the challenges of rising home prices, increased closing cost burdens, and higher denial rates due to asset insufficiency. As deposit-funded lenders, banks can enhance mortgage affordability, especially for low-income borrowers and first-time homebuyers. Banks are well positioned to leverage the Special Purpose Credit Program (SPCP) framework and invest in effective housing counseling agencies and Community Development Financial Institutions (CDFIs) to support downpayment assistance and closing cost subsidies. Tailoring support to meet local communities’ needs requires precise tools like the Federal Reserve’s Community Credit Insecurity Index (CII) for effective credit-gap assessments. Lenders could integrate the CII into their community needs assessment plans to help identify nuanced gaps and tailor assistance measures to local needs more effectively.
Data and Model
We used the 2021 and 2022 vintages of the public HMDA data matched to the “Avery File” lender classification file to assess the relationship between loan closing costs and originator model. The regression framework comprised three broad levels of controls: borrower, loan, and neighborhood. Borrower-level controls include LTV, DTI, income, race and ethnicity, rate spread, among others. Loan controls include interest rate, loan size, lender credit indicator, and loan type. Neighborhood controls include census tract racial composition, share of college-educated residents with a 4-year or graduate degree, tract-level community insecurity index values, and a market competition index measure to capture the influence of lender competition on the structure of closing costs.
Finally, year and county fixed effects are added to control for unobserved variation in year of origination and the influence of deterministic place-based effects on closing costs. Some costs are place-specific and vary across counties, including these county-level fixed effects allows us to control for unobserved variation in the places borrowers reside to appropriately assess whether comparable borrowers from the same county incur similar fees. This allows to isolate the conditional correlations between closing costs and the main variables of interest: low-income status, lender type, and race and ethnicity. NSMO regressions include similar styled controls in addition to additional borrower-level attributes available in the public file.
We thank our research team, specifically Khushboo Chougule for her hard work and contribution to this research. Additionally, we thank Elizabeth Ellis, Sarah Figgatt, Oscar Cruz, Sarah Kuehl, Bryan Kim, Clarke Wilson, and Annabel Jouard for their support. We are indebted to our internal partners and colleagues, who support delivery of our agenda in a myriad of ways, and acknowledge their contributions to each and all releases.
We are also grateful for the invaluable constructive feedback we received from external experts and partners, including Michael Neal of the Urban Institute. We are deeply grateful for their generosity of time, insight, and support.
We would like to acknowledge Jamie Dimon, CEO of JPMorgan Chase & Co., for his vision and leadership in establishing the Institute and enabling the ongoing research agenda. We remain deeply grateful to Tim Berry, Head of Corporate Responsibility, Heather Higginbottom, Head of Research, Policy & Insights, and others across the firm for the resources and support to pioneer a new approach to contribute to global economic analysis and insight.
This material is a product of JPMorgan Chase Institute and is provided to you solely for general information purposes. Unless otherwise specifically stated, any views or opinions expressed herein are solely those of the authors listed and may differ from the views and opinions expressed by J.P. Morgan Securities LLC (JPMS) Research Department or other departments or divisions of JPMorgan Chase & Co. or its affiliates. This material is not a product of the Research Department of JPMS. Information has been obtained from sources believed to be reliable, but JPMorgan Chase & Co. or its affiliates and/or subsidiaries (collectively J.P. Morgan) do not warrant its completeness or accuracy. Opinions and estimates constitute our judgment as of the date of this material and are subject to change without notice. No representation or warranty should be made with regard to any computations, graphs, tables, diagrams or commentary in this material, which is provided for illustration/reference purposes only. The data relied on for this report are based on past transactions and may not be indicative of future results. J.P. Morgan assumes no duty to update any information in this material in the event that such information changes. The opinion herein should not be construed as an individual recommendation for any particular client and is not intended as advice or recommendations of particular securities, financial instruments, or strategies for a particular client. This material does not constitute a solicitation or offer in any jurisdiction where such a solicitation is unlawful.
Wheat, Chris, and Makada Henry Nickie. 2024. “Hidden costs of homeownership: Race, income, and lender differences in loan closing costs.” JPMorgan Chase Institute. https://www.jpmorganchase.com/institute/research/household-debt/hidden-costs-of-homeownership-race-income-and-lender-differences-in-loan-closing-costs


JPMorgan Chase & Co.'s website terms, privacy and security policies don't apply to the site or app you're about to visit. Please review its website terms, privacy and security policies to see how they apply to you. JPMorgan Chase & Co. isn't responsible for (and doesn't provide) any products, services or content at this third-party site or app, except for products and services that explicitly carry the JPMorgan Chase & Co.