We no longer support this browser. Using a supported browser will provide a better experience.
Please update your browser.
This report examines the role of unemployment insurance (UI) in mitigating the financial impacts of job loss, one of the most common economic shocks that families experience. Using an anonymized sample of 160,000 Chase customers, this study provides a first-ever look into comprehensive and high frequency measures of spending behavior over the course of an unemployment spell among a large sample of UI recipients. With just 27 percent of the unemployed receiving UI—a record low recipiency rate—and the rapid growth of the contingent workforce, this report provides a critical fact base to inform efforts to reform UI and to redesign the social safety net for the 21st century.
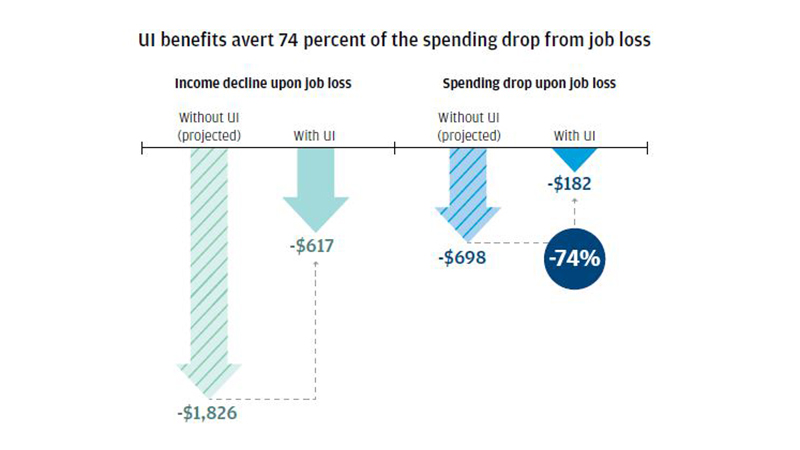
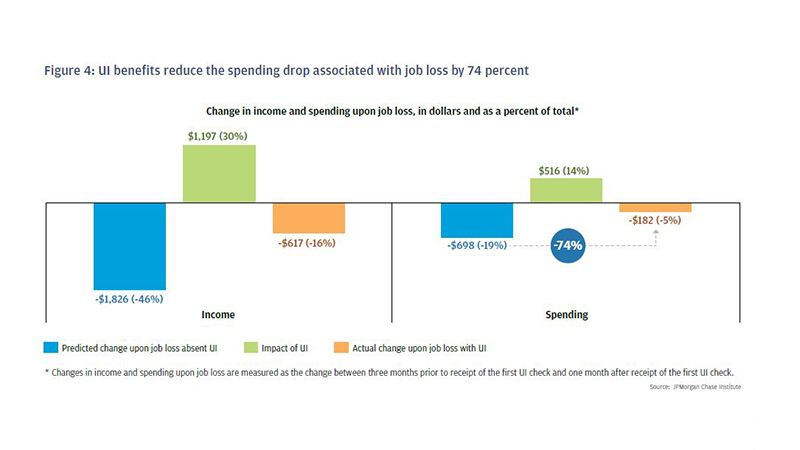
1. UI softens the drop in family income due to job loss from roughly $1,826 a month—a 46 percent drop in monthly income—to just $617 a month—a 16 percent drop.
2. Spending drops by just 5 percent upon job loss because UI benefits boost spending dramatically, averting 74 percent of the potential drop absent UI.
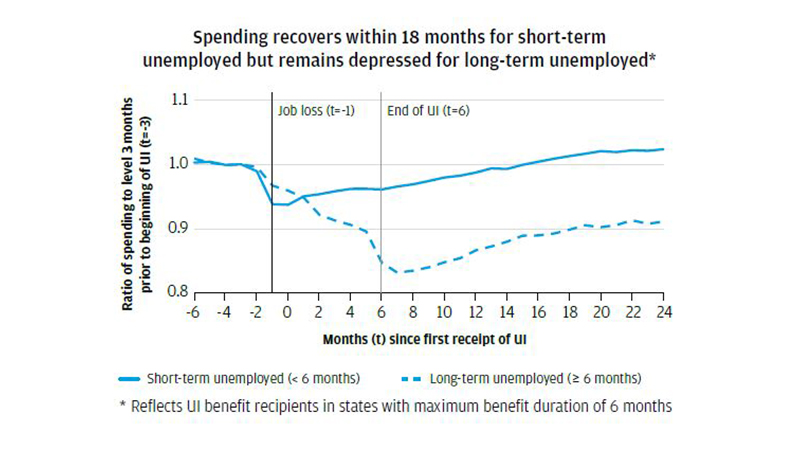
3. Spending declines coincide with income losses. Income and spending recover within 18 months for the short-term unemployed but remain depressed for the long-term unemployed. When UI benefits are less generous, the longterm unemployed experience more economic hardship but also go back to work sooner.
4. Among all UI recipients, job loss causes a drop in discretionary spending and student loan payments, but the longterm unemployed cut nearly every category of spending when UI runs out.
5. Families with high liquid assets reduce their spending upon job loss by roughly half as much as families with low liquid assets.
The experience of unemployment is nearly universal. Surveys show that over 90 percent of baby boomers have had at least one unemployment spell, and, every year, about one in four working adults experience a period of joblessness. These individuals face a substantial income loss. In Paychecks, Paydays, and the Online Platform Economy, we documented the high degree of income volatility that families experience. Unemployment insurance (UI) benefits provide wage replacement for individuals in the event that they lose their job. In this report, we evaluate the role that UI plays in mitigating the financial impacts of job loss, which is a key source of income and expense volatility. Our report is a first-ever look into comprehensive and high frequency measures of spending behavior among a large sample of the unemployed in the US.1
Although the UI system is intended to protect workers against the consequences of job loss, most unemployed workers do not receive UI. Roughly 90 percent of workers have the types of jobs that make them eligible for UI, but many unemployed people are still ineligible for a variety of reasons.2 Other unemployed people have already exhausted their unemployment benefits. In total, just 27 percent of unemployed people nationwide, roughly two million individuals a month, received unemployment insurance in 2015. This is the lowest recorded recipiency rate since World War II.3 In some states with particularly restrictive eligibility requirements, such as Florida, Georgia, and Louisiana, fewer than 15 percent of jobless workers received UI in 2015, compared to more than 70 percent in North Dakota. The level and duration of unemployment insurance benefits also varies by state.4 These benefits are typically intended to replace 30-50 percent of pre-tax wages on a weekly basis for up to six months or until the individual finds another job.
With the rapid growth of independent contractors, record low labor force participation rates, and an increase in the share of total unemployed who are long-term unemployed, the fraction of Americans working in traditional W-2 employee arrangements with eligibility for benefits, such as UI, is shrinking. These trends have stirred lively debates about the future of work and how the social safety net might be redesigned for the 21st century.
This report informs three key debates regarding UI reform and the social safety net more broadly. First, there have been recent policy proposals to expand coverage of UI benefits to part-time workers and those who must leave a job due to compelling family reasons or family illness. We contribute to this debate by estimating how much of the potential spending drop from unemployment is averted by UI based on a comparison of UI recipients in states with high versus low UI benefits. Second, in the wake of the Great Recession some states have cut maximum benefit durations below the traditional 26-week norm. In response, advocates have proposed a federal requirement that states offer up to 26 weeks of benefits. We can assess the impact of this proposal by comparing the spending trajectory in Florida—which offered 14 weeks of benefits in 2015—to spending trajectories in states that offer 26 weeks of benefits. Finally, some proposals seek to make the social safety net more portable, by, for example, establishing “individual security accounts” based on pro-rated employer contributions. We explore how liquid assets levels—a proxy for the potential safeguard of individual security accounts—are correlated with spending levels after job loss.
Our dataset offers good coverage of the financial lives of UI recipients.5 From a universe of 28 million Chase checking account customers we rely on an anonymized sample of 160,000 regular Chase customers who received unemployment insurance between 2014 and 2016 across 18 states. To be eligible for UI benefits, a claimant needs substantial work history in the prior year. As a result, the typical UI recipient is a middle-income household with a bank account.6 Subjects in our dataset who receive direct deposit of their UI benefits have similar incomes, spending levels, ages, and checking account balances to external benchmarks from public use datasets, suggesting that our results here are likely to generalize to all UI recipients.
Our results show that UI is remarkably effective at preventing large spending drops among the short-term unemployed. We organize our results into five findings. First, UI softens the drop in family income due to job loss from roughly $1,826 a month—a 46 percent drop in monthly income—to just $617 a month—a 16 percent drop. Second, spending drops by just 5 percent upon job loss because UI benefits boost spending dramatically, averting 74 percent of the potential drop absent UI. Third, spending declines coincide with income losses. Income and spending recover within 18 months for the short-term unemployed but remain depressed for the long-term unemployed. When UI benefits are less generous, the long-term unemployed experience more economic hardship but also go back to work sooner. Fourth, among all UI recipients, job loss causes a drop in discretionary spending and student loan payments, but the long-term unemployed cut nearly every category of spending when UI runs out. And finally, families with high liquid assets reduce their spending upon job loss by roughly half as much as families with low liquid assets.
From a universe of 28 million Chase checking account holders, we assembled an anonymized sample of 160,000 families across 18 states who met the following five criteria.
1. Received direct deposit of their first UI check after December 2013 and their last UI check before June 2015
2. Received UI for six or fewer contiguous months
3. Experienced one spell of receiving UI benefits7
4. Live in states that offer 26 weeks of UI benefits. In Finding 3, we compare this group to UI recipients in Florida where benefits lasted 16 weeks in 2014 and 14 weeks in 2015
5. Have at least five outflows out of their checking account in the three months prior to and after UI receipt
Among our sample, median earnings among families that received UI benefits was $4,540, roughly comparable to the national median of $5,106. Among the families in our sample, we studied income and spending by analyzing inflows and outflows out of the checking account as well as on Chase debit and credit cards. We defined income as all inflows which are not explicitly categorized as transfers from other financial accounts, and we rescaled take-home labor income into pre-tax dollars. We defined spending to include debit card expenditures, Chase credit card expenditures, consumer debt payments (mortgages, auto loans, non-Chase credit cards, and student loans), bills (e.g. electricity, cable, insurance) and cash withdrawals from the ATM.
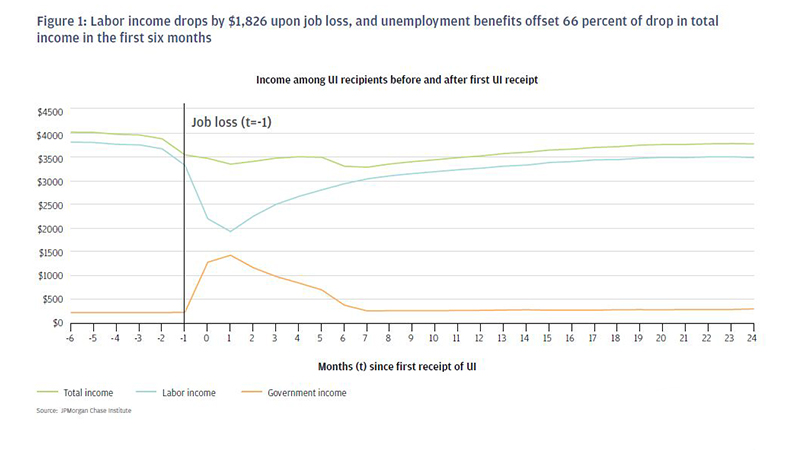
Unemployment causes a large—though usually short-lived—drop in labor income. Figure 1 shows labor income, government income, and total income for UI benefit recipients in the six months prior to and 24 months after the first month in which they received UI. Upon job loss, which typically occurs one month before the first receipt of UI benefits, take-home labor income for the typical family falls by $1,826, a 46 percent drop in total income.8 In aggregate, unemployment insurance offsets $1,197 of that income loss, replacing 66 percent of the lost $1,826 of labor income.9 Once UI benefits are taken into account, average total income falls by $617, a 16 percent drop, upon job loss. Mean total income begins to recover after reaching its lowest point seven months after the first receipt of UI, but does not return to pre-job loss levels within our two-year time frame. The gradual recovery in labor income shown in Figure 1 largely reflects a growing share of that population finding new jobs.
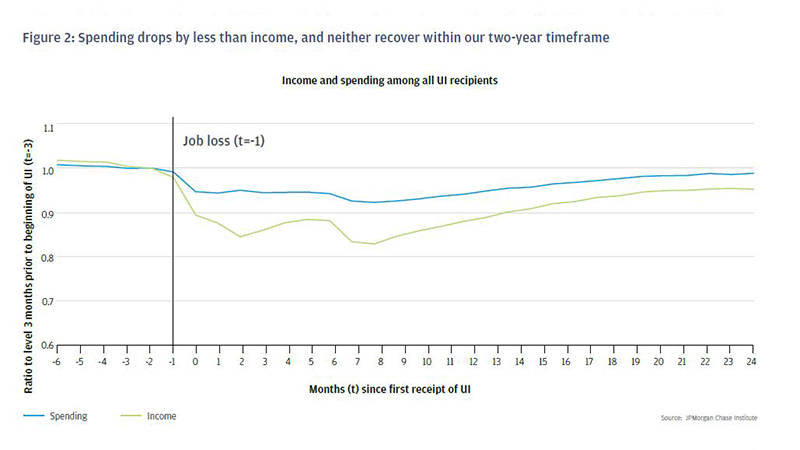
The path of spending mirrors the path of income in the wake of an unemployment spell (Figure 2). However, the impact on spending is much smaller than the impact on income. While total income drops by 16 percent upon job loss, spending drops by just 5 percent in aggregate upon job loss—just $182. Spending drops by a total of 8 percent at its low point seven months after first receiving UI before almost fully recovering 24 months after first receiving UI (Figure 2).10
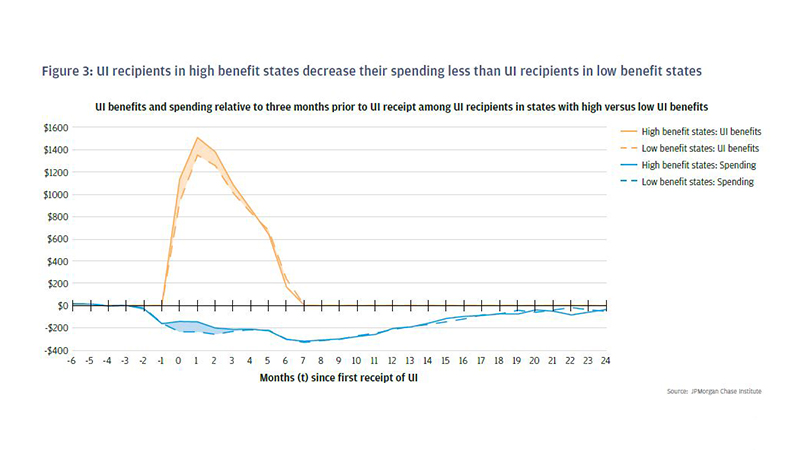
Families that receive UI in states with relatively more generous UI benefits experience a smaller decrease in spending during unemployment. To estimate the impact of UI benefit levels on spending, we compare states with high UI benefits, where benefits replace 40 percent of total family income, to states with low UI benefits, where benefits replace 34 percent of total family income.11 In high-benefit states, families receive an extra $227 per month in UI benefits and show a $82 smaller drop in spending at start of unemployment (Figure 3). Put differently, people in states where UI benefits are $1 higher have a 36-cent smaller drop in spending at the start of unemployment. This cross-state comparison between high- and low-benefit states suggests that UI benefits play an important role in cushioning the impact of unemployment on not just income but also spending.
To assess what the path of spending might have been for a worker who did not receive UI benefits, we extrapolate from cross-state differences in UI benefit levels. First, as stated above, we note that states that paid $227 less in benefits had a $82 larger drop in spending, suggesting that people spend 36 percent of received UI benefits. Second, we apply that percentage to the full amount of monthly UI benefits: if people spend 36 percent of the full $1,423 monthly benefit, that means that UI benefits boost their total spending by $516. Put differently, in the absence of UI, they would have spent $516 less (36 percent of $1,423) upon job loss. Third, we observe that in fact spending only dropped on average by $182 upon job loss among people who did receive the UI benefit. We deduce that, absent the UI benefit, spending would have dropped by $698 ($516 plus $182). UI is highly effective at cushioning the short-term blow from job loss. In percentage terms, as a result of UI benefits, total income dropped by just 16 percent instead of 46 percent, and spending dropped by 5 percent instead of 19 percent. Therefore we conclude that UI benefits mitigated 74 percent of that potential spending drop upon job loss.12
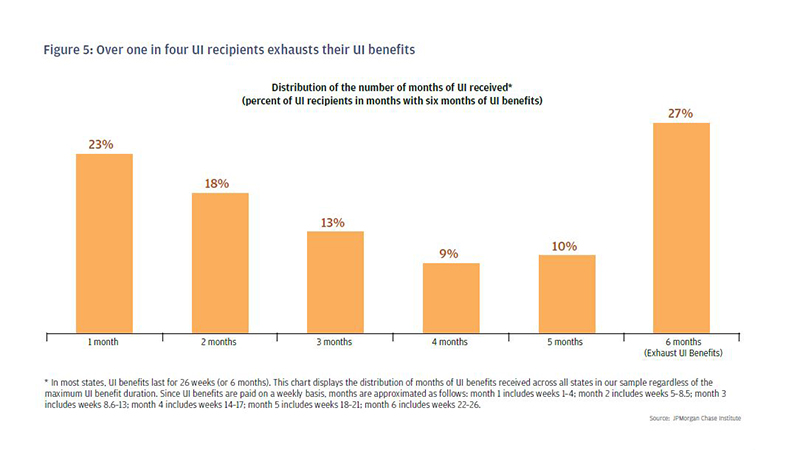
Most unemployment spells are short-term, lasting less than six months. UI is paid on a weekly basis until the individual finds another job, and so UI durations can be used to measure how long it took a jobseeker to find a job. Among our sample of UI recipients in states that offer six months of UI benefits, 23 percent of recipients find a job within the first month and therefore receive UI benefits for one month or less, 18 percent receive UI for two months, 13 percent for three months, 9 percent for four months, and 10 percent for five months. The remaining 27 percent remain unemployed for six months or longer and exhaust their UI benefits (Figure 5).
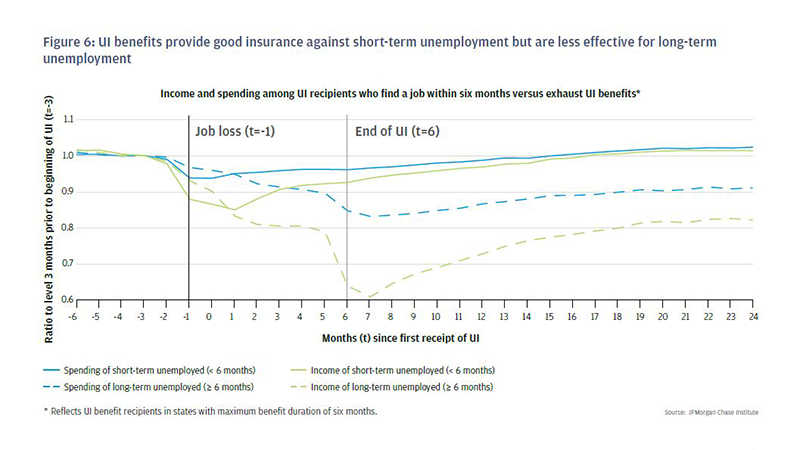
UI does a good job of cushioning the blow of job loss for the short-term unemployed, but not the long-term unemployed. Those who find a job within six months experience less dramatic and shorter-lasting drops in income (Figure 6). Their income recovers completely within 18 months, possibly because the short-term unemployed are able to be more selective and take high-quality, highwage jobs. The long-term employed, roughly one in four UI recipients who take longer than six months to find a job, exhaust their UI benefits and their income recovers much more slowly.
Spending drops are also more dramatic for the long-term unemployed than for the short-term unemployed. Among individuals unemployed for fewer than six months, spending drops by 6 percent upon job loss and begins recovering immediately with full recovery by month 16. For those unemployed longer than six months, spending drops by 4 percent upon job loss. Spending drops in total 17 percent by month seven when UI benefits run out, after which spending begins to recover but does not return to pre-job loss levels within our two-year timeframe.
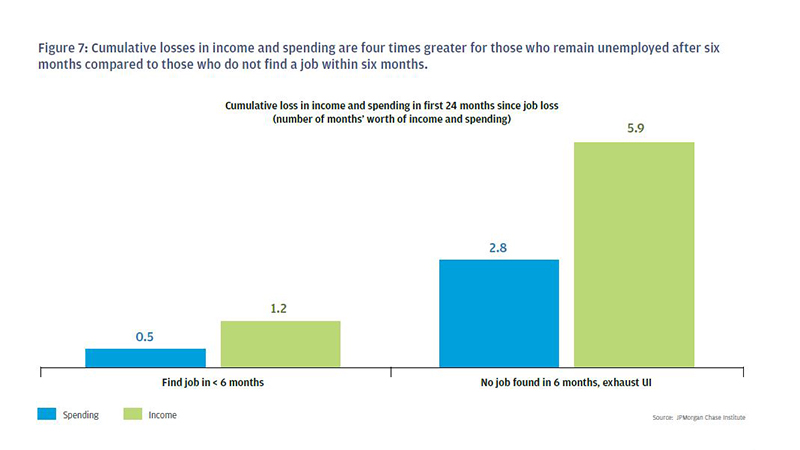
Cumulative losses in income and spending are at least four times greater for those who remain unemployed after six months compared to those who find a job within six months (Figure 7). UI recipients who find a job within six months experience a cumulative labor income loss of $8,938, and, once UI benefits are taken into account, $4,748 or just over one month’s worth of income. Cumulatively, these individuals cut spending by roughly one-half of one month’s worth of spending. UI recipients who remain jobless after six months experience a much larger cumulative labor income loss of $32,669 and, once UI is taken into account, $21,217 or over five months' worth of income. This translates into more than two months' worth of lower spending over the two-year timeframe.
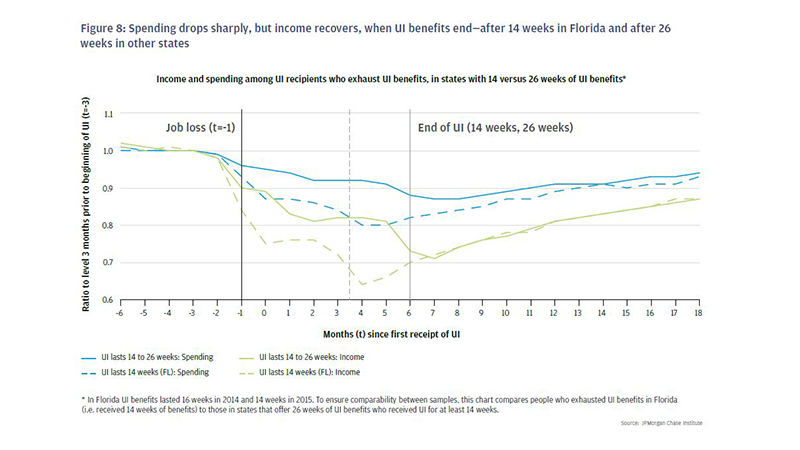
Additional evidence that UI benefits directly affect income and spending during unemployment comes from a comparison of Florida with other states. Among states in our sample, Florida offers uniquely low unemployment insurance benefits: the maximum benefit duration is tied to the unemployment rate and was 16 weeks in 2014, 14 weeks in 2015, and 12 weeks in 2016; and real benefit levels have fallen by one-third since 2002. Figure 8 compares income and spending of UI recipients who exhausted UI benefits in Florida, which paid a maximum of just 14 weeks of benefits in 2015, to those in states that offer 26 weeks of UI benefits but who received UI for at least 14 weeks. UI benefits are also considerably lower in Florida ($1,010) compared to other states ($1,423). As a result, average incomes in Florida fall more precipitously upon job loss but they start to recover four months after the start of UI benefits, whereas they start to recover after six months in other states. Thus the timing of income recovery coincides with the length of UI benefits.
The depth and timing of spending cuts across states closely follow the path of income. In Florida, UI recipients cut their spending by 13 percent immediately upon job loss compared to just 5 percent among individuals in states with six months of UI benefits. When UI benefits run out, recipients make further cuts to their spending totaling 20 percent in month four in Florida and 12 percent in month six in other states. The cumulative loss of spending in the 18 months after UI receipt is considerably larger in Florida (2.6 months worth of spending) to other states (1.7 months worth of spending).
Florida’s less generous unemployment benefits, in terms of both level and duration, seem to result in a spending drop that is 49 percent bigger than the typical state.13 Despite these deeper cuts in income and spending in Florida, income and spending exhibit similar recovery paths after 12 months. This cross-state evidence suggests that the faster reemployment in Florida does not necessarily lead to improvements in job quality.
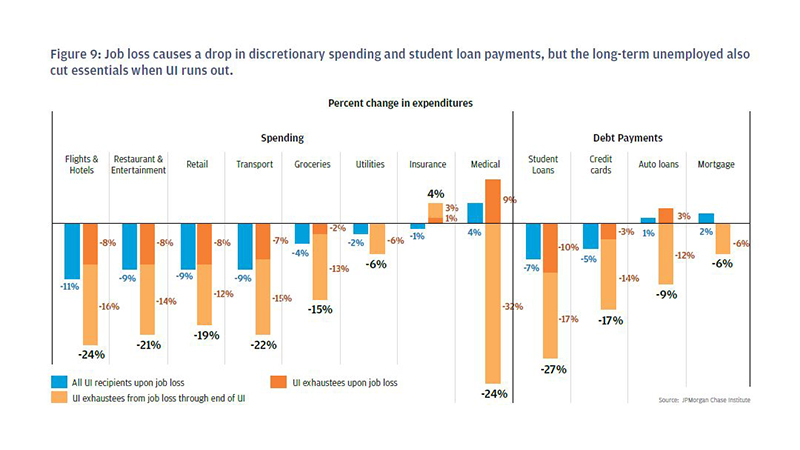
At the onset of unemployment, discretionary spending drops sharply. Spending on flights and hotels, restaurant and entertainment, retail, and transport, drops by 9 percent or more (Figure 9). A decreased need for spending on work-related items helps to explain these patterns. When someone stops working, they no longer need to pay every day for expenses like gas to get to work and buying food at the cafeteria. Among all UI recipients upon job loss, spending on non-work related goods such as groceries and utilities drops modestly. Payments to insurance companies and out-of-pocket medical expenses actually increase upon job loss, possibly due to the expiration of employer-sponsored medical benefits.
UI recipients who do not find a job within six months and exhaust their UI benefits face serious material hardship. In Figure 9 we aggregate the drop in spending from the onset of UI with the additional drop in spending that occurs when UI benefits run out. People make more dramatic cuts to discretionary spending categories by the time UI benefits have run out: spending on flights and hotels, restaurants and entertainment, retail, and transport falls by 19 percent or more. However, people also cut essentials by the time UI benefits have run out—their spending on groceries falls by 15 percent, and even medical expenditures drop by 24 percent.14
UI recipients do not cut back on most types of debt payments upon job loss. Eventually, the long-term unemployed make modest cuts to payments on their credit cards (17 percent), auto loans (9 percent), and mortgages (6 percent) when UI benefits run out. The major exception is student loan payments, which fall by 7 percent upon job loss and 27 percent among the long-term unemployed once UI benefits expire. One possible explanation is that the consequences of mortgage and auto delinquency (repossession) and credit card delinquency (loss of a liquid buffer) are more severe than the consequences of student loan delinquency. In addition, income-based repayment policies may allow people in some states to suspend or reduce their student loan payments when their income drops.
Spending drops by much less than total income at job loss (5 percent compared to 16 percent), so how do families make up the difference? We see some evidence that people are using more credit products but not enough to make up the full difference. As mentioned above, debt payments decline only modestly. On average, people borrowed $19 more per month on credit cards during UI receipt. Since people are not using formal credit, they must be drawing down on their liquid assets or borrowing from within their social networks. In fact, during UI receipt, checking account balances drop by $43 per month. Inflows from external accounts increase by $16 per month—representing either transfers from a family’s non-Chase account or contributions or loans from friends and family. It is possible that families are using unobserved resources to sustain their spending during unemployment.
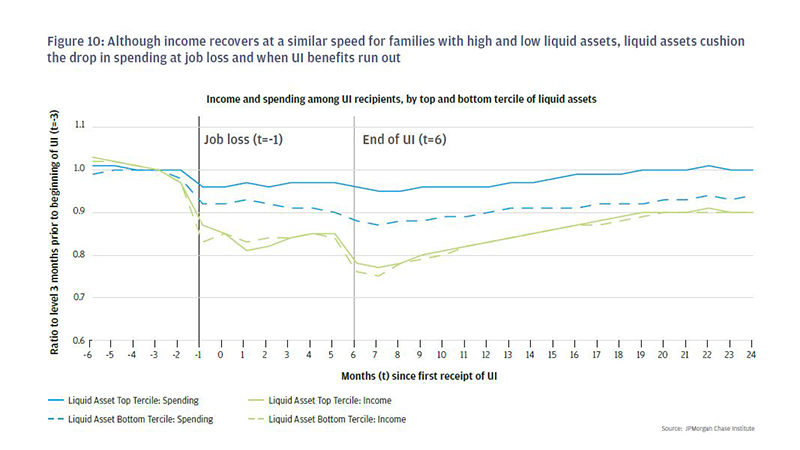
We explore the use of private funds as a proxy to understand what it might mean for individuals if they had access to more portable benefits such as individual security accounts. Liquid assets partially mitigate the spending drop associated with job loss. We measure a family’s liquid asset buffer as the ratio of their estimated liquid assets to their monthly spending prior to unemployment and group families into terciles. Figure 10 illustrates income and spending for families with different asset buffers. The income loss from unemployment across asset groups is quite similar, but liquid asset holdings are strongly correlated with the extent of the drop in spending. Upon job loss, families with low liquid assets (in the bottom third in terms of liquid assets) cut their spending by 8 percent, while people with high liquid assets cut their spending by just 4 percent. The spending patterns of these groups diverge further when UI benefits run out—families with low liquid assets cut their spending by a total of 13 percent compared to a total of just 5 percent among families with high assets.
How effective are liquid assets at helping to smooth consumption? As a point of comparison, according to the 2013 Survey of Consumer Finances, among employed households with a checking account moving from the bottom tercile to the top tercile in liquid assets is associated with having roughly $30,000 more in liquid assets. Applying our estimates of spending among UI recipients in the bottom- and top-terciles of liquid assets within the Chase sample to the national distribution of liquid assets implies that a $30,000 increase in liquid assets would yield the same improvement in consumption smoothing as $227 more in UI benefits per month.15 Put differently, a $100 increase in UI benefits has the same effect on spending as an additional roughly $8,000 in liquid assets. Although the relationship between asset holding and the spending drop is not necessarily causal, this calculation implies that UI benefits are more effective than liquid asset holdings at smoothing spending during unemployment.
Studying the income and spending behavior of UI recipients reveals both good and bad news about the role of UI in mitigating the hardships that stem from job loss. The good news from our paper is that, on average, UI benefits cushion most of the blow to families experiencing short-term unemployment who receive UI. Spending does not fall by much at the start of unemployment, and the drop is concentrated in discretionary spending categories. Both income and spending recover in the ensuing months. For those who receive UI, benefits play a critical role in mitigating hardship.
However, UI currently only covers 27 percent of unemployed workers, and expanding eligibility would likely help additional job losers to smooth their consumption. The growth in alternative work arrangements over the past twenty years has shrunk the base of people eligible for UI, contributing to UI recipiency dropping to its lowest recorded level. Reforming UI eligibility requirements to reflect today’s labor market and to allow more to participate would expand the positive impacts of UI considerably, particularly among those with limited liquid asset buffers.
Even if eligibility were expanded, the long-term unemployed still experience significant hardship. Spending drops sharply when benefits run out, indicating that benefit exhaustion requires a large adjustment in economic routines. Spending drops across a wide variety of categories including groceries and health care, suggesting that families have a meaningful decline in their well-being after benefits run out. Further, even though UI benefit exhaustion is increasingly likely with each additional month of unemployment, the data show that the drop in spending at UI exhaustion is sudden. Families do not generally prepare for UI benefits to run out.
Looking beyond eligibility, the duration and level of UI benefits also affect the spending of the unemployed. UI recipients in Florida (which offers UI benefits that are less generous than most states in terms of both maximum level and duration) experience more hardship than UI recipients in other states. This suggests that ensuring a minimum number of weeks of UI benefits across all states (e.g., 26 weeks) would reduce hardship in some places. One consideration, however, is that when UI benefits are less generous, people go back to work sooner. These findings therefore point to a potential trade-off that policymakers must weigh when reforming UI benefits, namely whether to reduce the time to reemployment or alleviate more of the economic hardship
Finally, our data suggest that promoting liquid asset accumulation is unlikely to be a sufficient path to helping people smooth spending during unemployment. We calculated that moving from the bottom tercile to the top tercile of liquid assets, which is associated with having roughly $30,000 more in liquid assets, yields the same improvement in consumption smoothing as just $227 more in UI benefits per month. Government policies are unlikely to be able to incentivize or organize asset accumulation of this magnitude, meaning that there is a continued role for targeted benefits such as UI as part of a social safety net.
Unemployment insurance is a critical element of our current social safety net that plays an important role in mitigating the impacts of job loss on income and spending. Families rely on UI benefits heavily and suffer when they run out. With the growth in independent work, UI is a benefit available to fewer and fewer Americans. The fact base presented here can help inform efforts to reform UI and develop other measures to address these new challenges.
We thank David Wasser for superb research assistance and Kevin Feltes for help with writing. We would also like to acknowledge the contributions and support of the entire JPMorgan Chase Institute team and the JPMorgan Chase Intelligent Solutions team of data experts, without whom this research would not have been possible.
We are also grateful for the invaluable inputs of academic and policy experts, including Jonathan Morduch for helpful suggestions, and Ed Dullaghan, Wayne Vroman, and Scott Schuh for sharing institutional knowledge related to the UI system and the payments system.
We would like to acknowledge Jamie Dimon, CEO of JPMorgan Chase & Co., for his vision and leadership in establishing the Institute and enabling the ongoing research agenda. Along with support from across the Firm—notably from Peter Scher, Len Laufer, Max Neukirchen, Joyce Chang, Matt Zames, Judy Miller, and Alexis Bataillon—the Institute has had the resources and support to pioneer a new approach to contribute to global economic analysis and insight.


JPMorgan Chase & Co.'s website terms, privacy and security policies don't apply to the site or app you're about to visit. Please review its website terms, privacy and security policies to see how they apply to you. JPMorgan Chase & Co. isn't responsible for (and doesn't provide) any products, services or content at this third-party site or app, except for products and services that explicitly carry the JPMorgan Chase & Co.